
12 Lead ECG
Fundamentals for Student Paramedics
Before interpreting rhythms, diagnosing abnormalities, or learning 12-lead ECGs, every student paramedic must first understand how to read the ECG itself. ECG interpretation is not about recognising patterns by luck — it is about understanding what the ECG is physically measuring and how that electrical activity appears on standardised paper.
This page focuses on ECG fundamentals:
How ECG paper works
What each wave and complex represents
How to recognise normal sinus rhythm confidently
These fundamentals form the foundation for all further ECG learning in ambulance practice.

ECG Paper: The Language of ECG Interpretation
ECG paper is standardised so clinicians anywhere can interpret ECGs consistently. If you understand the paper, you can extract accurate information from any ECG strip.
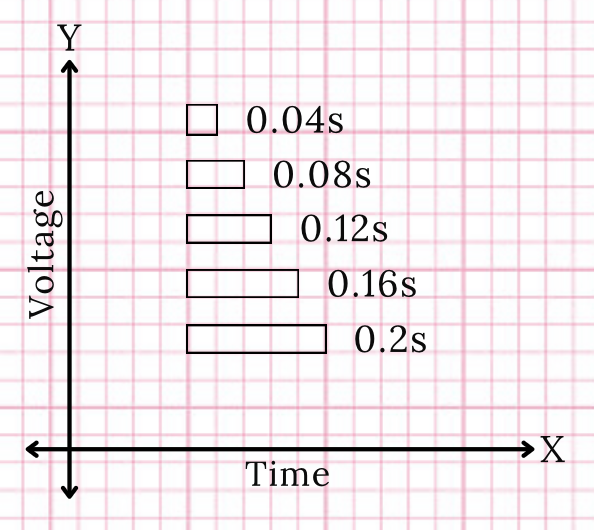
ECG paper is made up of small squares and large squares. There are 5 small squares in one large square.
The horizontal line = Time
The vertical line = Voltage
One small square is 0.04 seconds. Because there are 5 small squares in 1 large square, 1 large square is 0.2 seconds.
In the context of voltage, one square in height represents 0.1 millivolt. You may ask why any of this is important, but when it comes to interpreting intervals and segments this is very important. A 1st degree AV block is a PR interval of more than 0.2s. If you are unsure of what time is on ECG paper this will be impossible to work out.
Calculating the heart rate
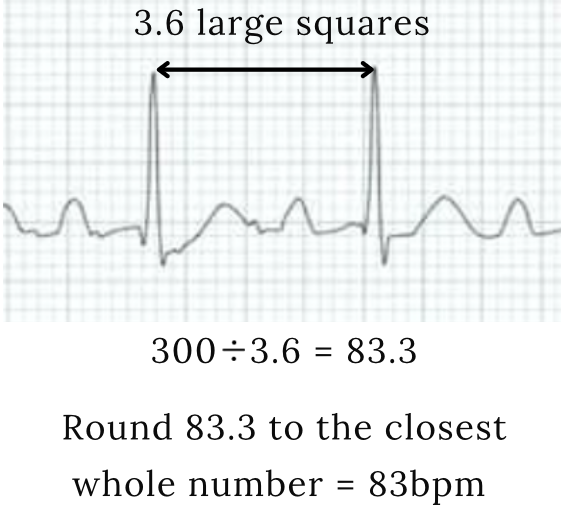
To work out the heart rate on an ECG, divide 300 by the number of large squares in between two QRS complexes and this will give you the answer. This is because 300 large squares equates to 1 minute. Therefore, by dividing 300 by the number of large squares in between two QRS complexes, this number will tell you the number of times a QRS complex occurs over 1 minute, and therefore the heart rate. This only works in patients with a regular ventricular rate.
Alternatively, you can count the number of small squares in between two QRS complexes and divide 1500 by this number. Because there are 1500 small squares in 1 minute.

ECG Waves and Complexes Explained Clearly
Each waveform on the ECG corresponds to a specific part of the cardiac electrical cycle. Learning what each wave represents makes interpretation logical rather than intimidating.
The PQRST Complex
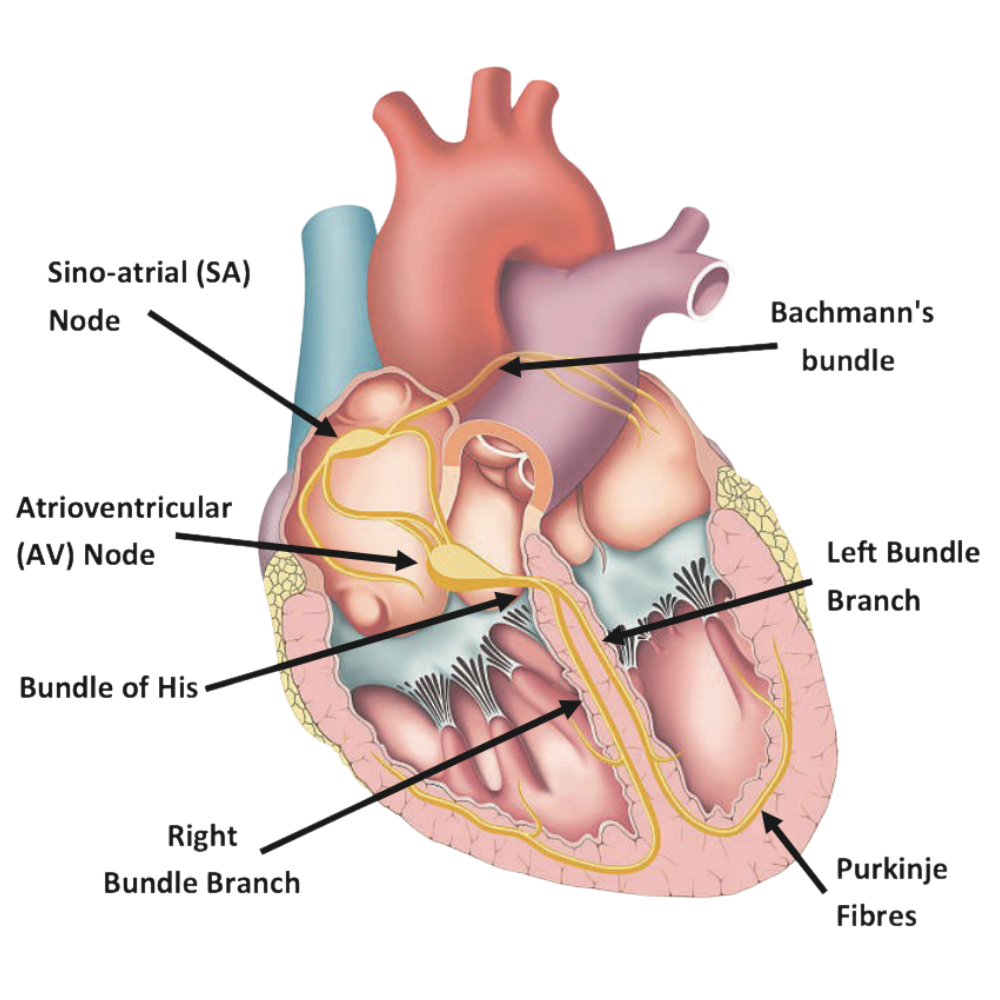
For the myocardium to contract, electricity has to depolarise the cells. The cardiac conduction system comprises of nodal cells to generate an impulse and conducting cells to transport electricity around the heart.
In a normal, healthy heart, the sino-atrial (SA) node should be the origin of the impulse. Electricity then travels across the atria via internodal pathways and bachmann’s bundle, meeting at the atrioventricular (AV) node. The AV node then impulses, sending electricity through the bundle of his. The pathway then splits into the left and right bundle branches and into the purkinje fibres.
After depolarising, cells repolarise which puts the myocardium into a resting state, ready to depolarise again to generate contraction of the myocardium.
The SA node will impulse independently between 60-100 per minute. If the AV node does not receive any electricity from above, it will indepedently impulse at a rate between 40-60 per minute. The purkinje fibres also have nodal cells which can impulse between 20-40 per minute if they do not receive any electricity from above.
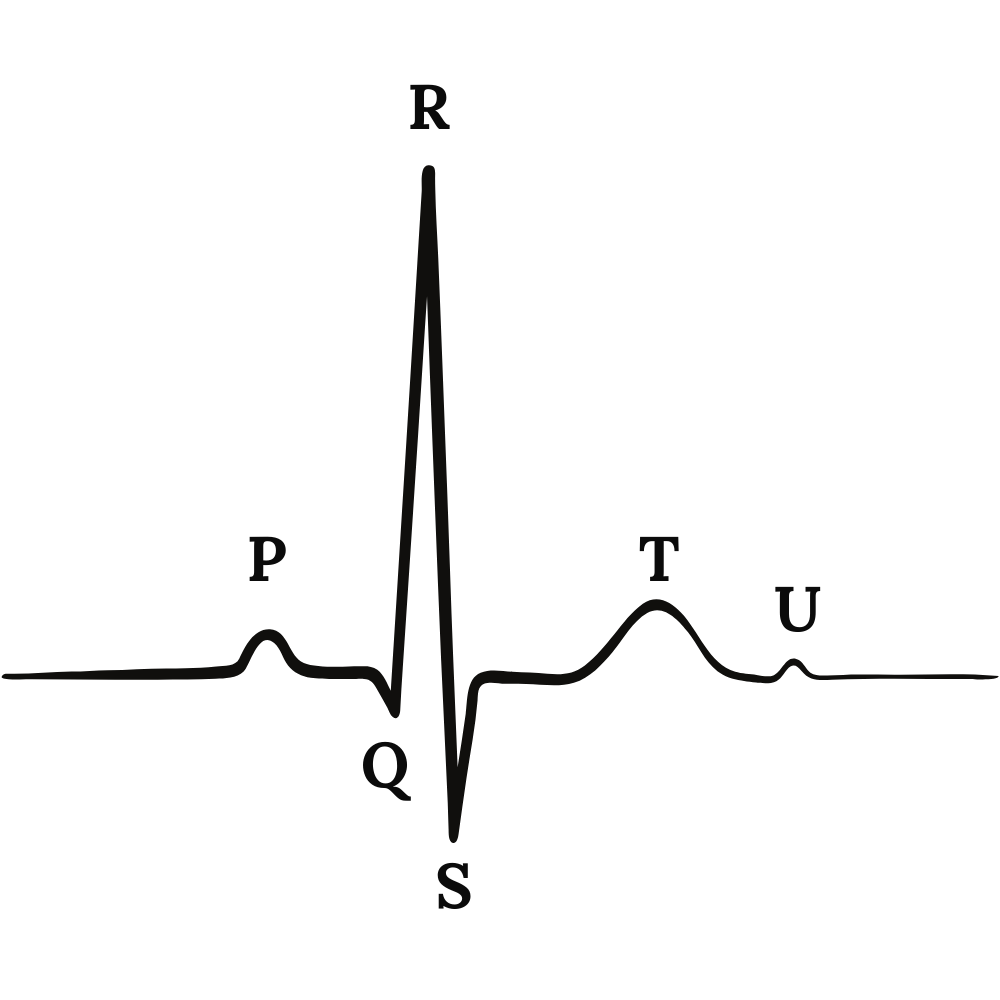
The P wave represents depolarisation of the atria.
In a healthy heart:
The SA node fires regularly
A P wave appears before each QRS complex
P waves look consistent in shape
For student paramedics, the most important question to ask is not what rhythm is this? but:
“Is there a P wave before every QRS, and does it look the same each time?”
If the answer is no, the rhythm is unlikely to be sinus in origin.
The QRS complex represents depolarisation of the ventricles.
The T wave represents repolarisation of the ventricles.
The U wave is not always present, but if there is a small deflection after the T wave then this is thought to represent depolarisation of the purkinje fibres.
Take your learning a step further!

Sinus Rhythm: The Reference Point for All ECGs
Sinus rhythm is the baseline rhythm from which all other ECG interpretation begins. If you cannot confidently recognise normal sinus rhythm, abnormal rhythms become significantly harder to identify.
ECG Characteristics of Sinus Rhythm
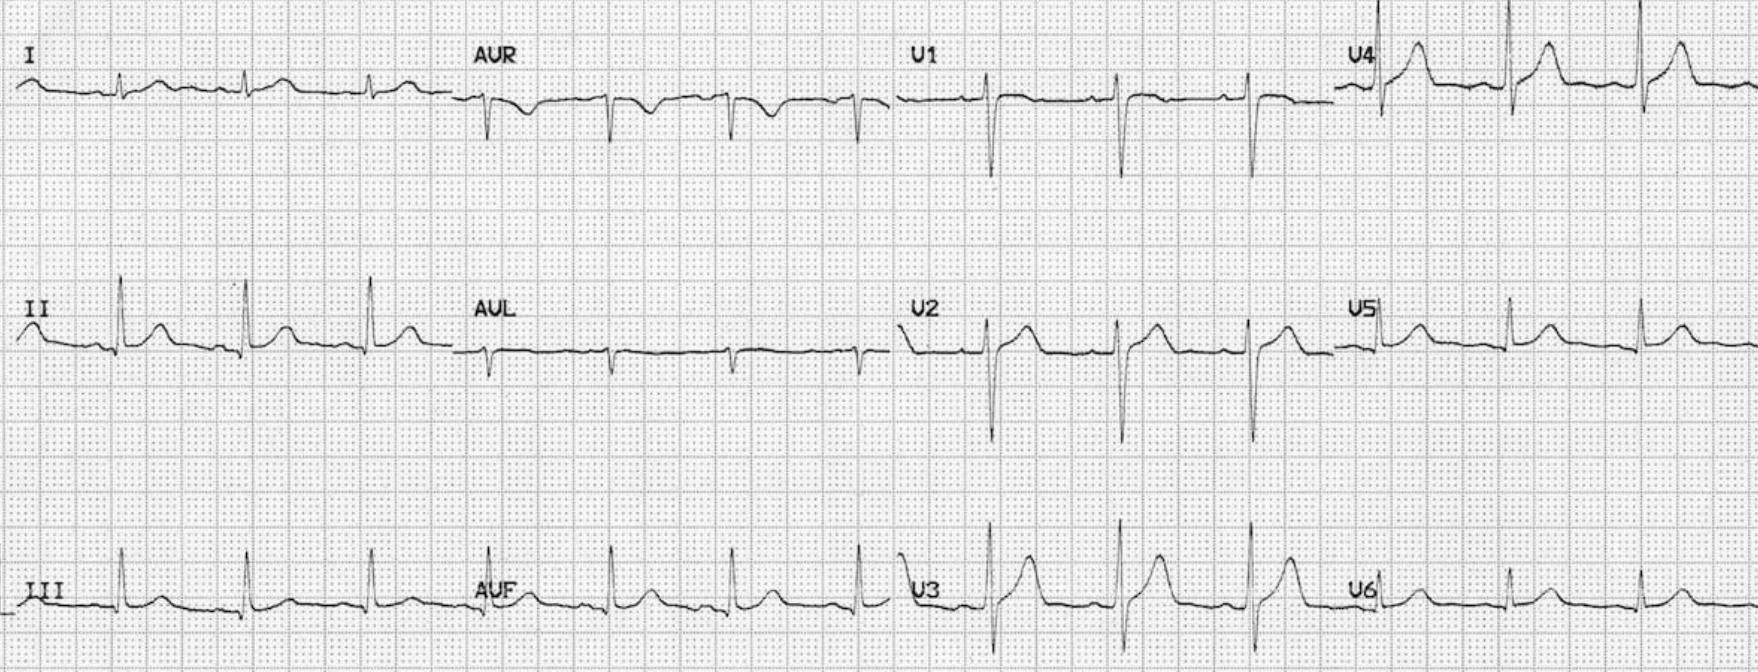
In sinus rhythm electrical activity begins in the SA node.
The ECG characteristics:
Regular rate between 60-100 bpm (or the correct rate in children).
Every QRS complex has a normal P wave before it.
P waves upright in leads I and II, inverted in aVR
The PR interval remains constant
Why Sinus Rhythm Is So Important for Students
Sinus rhythm is not just another rhythm to learn — it is your anchor.
If you can confidently identify sinus rhythm:
You reduce uncertainty
You communicate clearly with senior clinicians
You perform better in OSCEs
You avoid over-interpreting benign ECGs
Many ECG errors come from failing to recognise normality.

Common Errors Student Paramedics Make With ECG Fundamentals
Students often struggle with ECGs because they:
Skip ECG paper measurements
Jump straight to rhythm names
Focus on memorisation rather than understanding
Separate the ECG from the patient
Strong fundamentals prevent these errors.
Understanding ECG fundamentals is the first step toward confident ECG interpretation in ambulance practice. Progress comes from structure, repetition, and clinical context, especially for student paramedics and ambulance clinicians.
PocketClinician supports ongoing ECG development through:
Continue Your ECG Learning
ECG Pocketbook
Structured ECG interpretation guides covering rhythms, abnormalities, and exam-ready explanations.
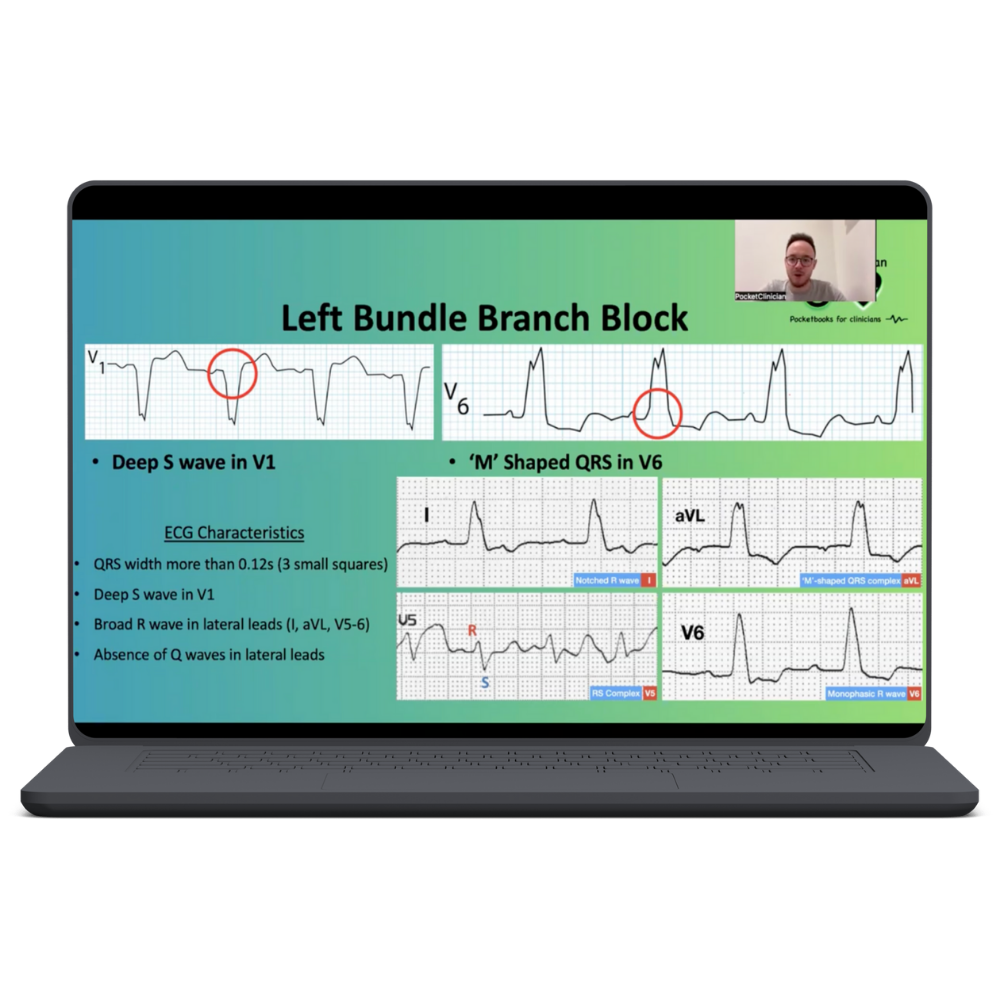
ECG Video Course
A 28 ECG video course starting at the basics. Giving you a visual and interactive course.
ECG Community
Regular ECG exposure, discussion, and shared learning with other student paramedics and clinicians.